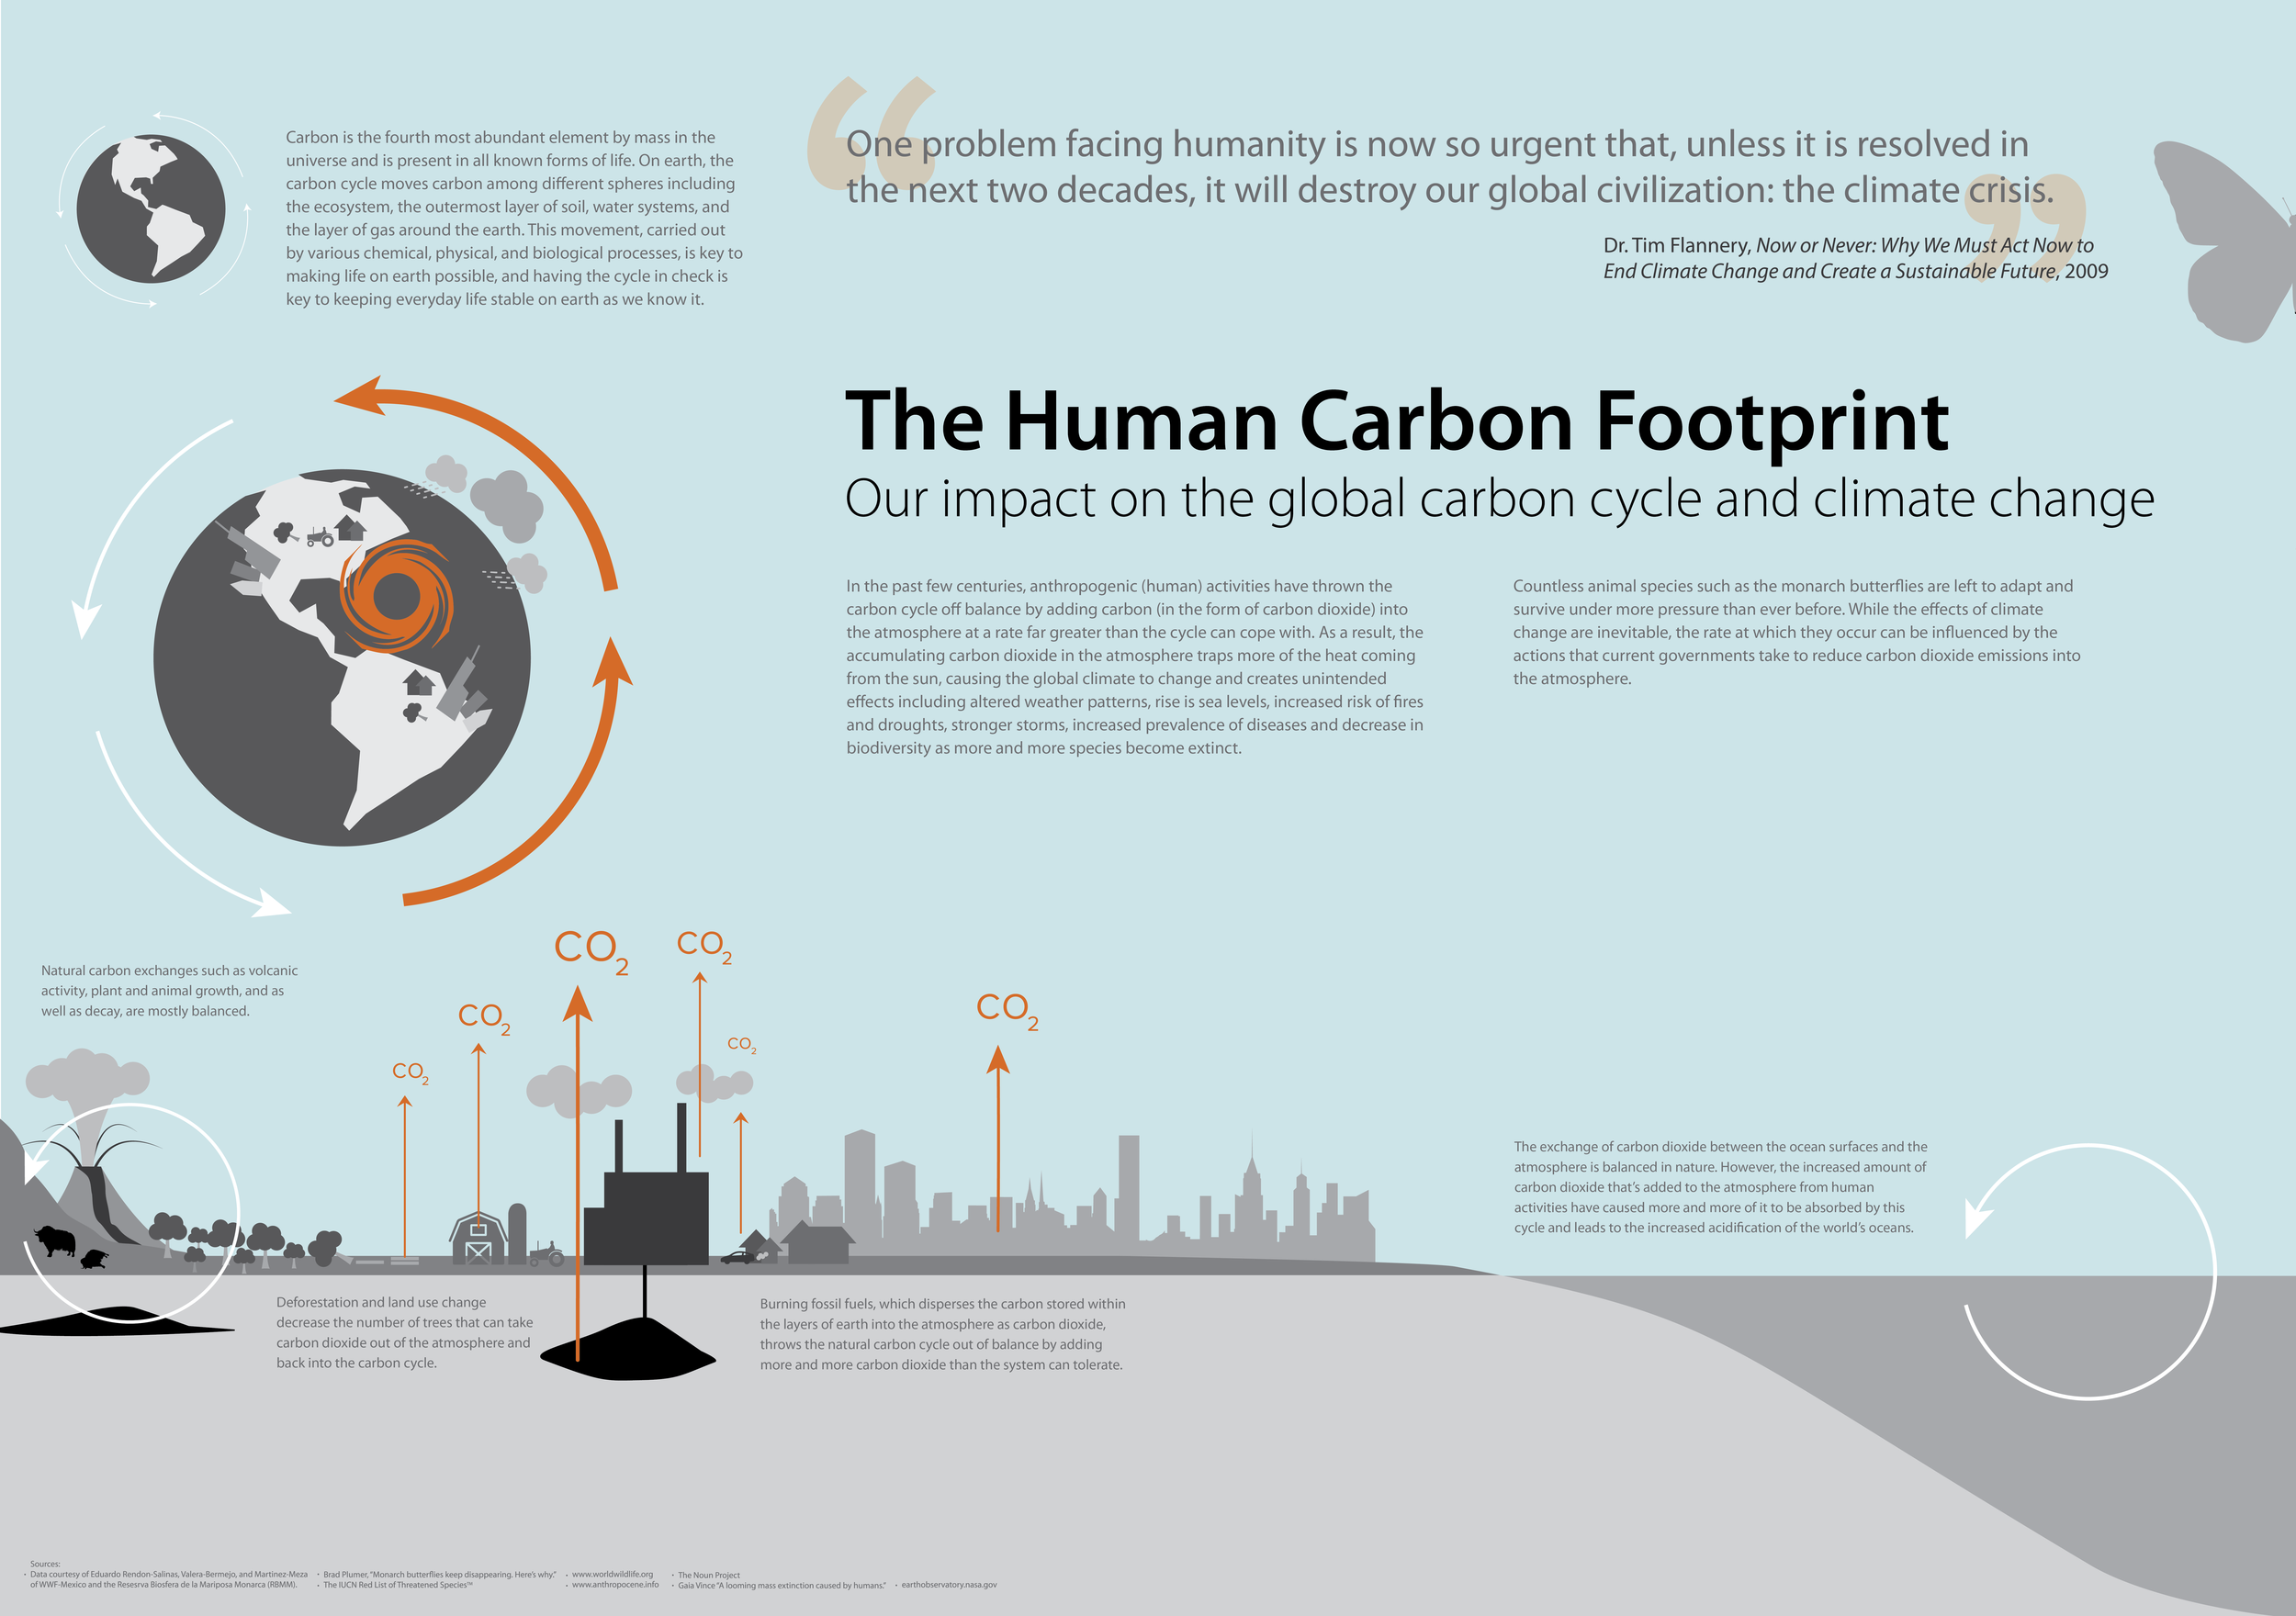
This data visualization, or infographic, was created using findings from the culmination of secondary research conducted about the carbon cycle and how the human carbon footprint has had a negative effect on the cycle. Finding the right balance between information management and visual representation was key in this project's execution and successful outcome.